
Brent Forwards Hit New Highs While No One Was Watching
Crude, Iran, and OPEC: Time to Review This Trade

February 28: the U.S. and Israel went to war with Iran. Today is April 29. Exactly two months in.
Hormuz is still functionally closed. Brent has gone from just above $70 pre-war to above $113 today. Physical Dated Brent printed as high as $144 in early April. The UAE just announced its exit from OPEC effective May 1. And per a WSJ report, Trump is now positioning the U.S. Navy’s blockade of the Strait as a long-term, deliberate strategy.
Time to sit down and run through the past two months, and our long-crude trade, the highest-conviction position we've sized into since the war started.
I. What We Got Right
1) Hormuz Has No Solution
This was the earliest, and clearest, line we put down once the war started.
Late February, early March: the market was still pricing oil on a one- to two-week Hormuz disruption. Sell-side models were still running the standard “short-term event shock” playbook. We took the opposite view: this thing has no short-term solution. Not because Iran is strong, but because what’s closing the Strait isn’t the Iranian navy. It’s “Iran’s asymmetric arsenal × the global maritime insurance system.” Air strikes don’t reopen it. Press releases don’t reopen it. A unilateral “we’re open” statement doesn’t reopen it.
On March 9, we put this view at the top of Hormuz Is the Real Battlefield: the market got the duration of the shock wrong, not the magnitude. Seven weeks later, that line has held. Hormuz is still closed today.
2) Crude Duration Was Severely Underpriced, Especially the Back End
The second call, validated over and over the past two months: the long end of the crude curve was extremely underpriced.
Our thesis from day one was duration. No short-term solution: the back end has to be wrong. So we started in the front month, but most of the work after that was bottom-fishing the back end at low levels, over and over. Every time the curve flattened, every time the back end got pushed back down, we treated it as another cheap chance to add. Long the back end, arb the curve. Repeatedly.
3) Even After “Hormuz Reopens” Rumors, We Kept Adding
April was full of “Hormuz is about to reopen” rumors. The April 8 ceasefire, and the April 17 unilateral declaration from Iran’s foreign minister that the Strait was “fully open” (falsified the same weekend by the renewed closure on April 18 and several vessels U-turning in front of the Strait). Every time, the market hammered the back end back to the floor.
We didn’t cut. Reason: none of those rumors touched the core of the problem. The Strait is closed by the insurance system, not by a press release. P&I clubs need weeks to months of continuous, safe transit history before they re-underwrite. Until that changes, Hormuz is closed, and the back end is wrong.
II. What We Got Wrong: Boots on the Ground
When we wrote Boots on the Ground. in late March / early April, the core call was this: long-term, for the dollar, for U.S. hegemony, for the entire U.S. alliance system in the Middle East, a ground operation was actually the most favorable outcome. Yes, expensive. But it would deliver a one-shot, decisive resolution to the Iran problem, and a structural relock of Hormuz as a U.S.-controlled chokepoint.
That’s not the road the U.S. took. It picked another. Possibly the right one in the short term: cheaper, more politically manageable, but with potentially deeper long-run consequences.
But to be clear: this doesn’t change the trade itself. Our trade thesis was never “the U.S. will send ground troops.” It was “Hormuz has no short-term solution.” Ground operation, long blockade, indefinite stalemate: none of these three paths reopens the Strait in the short term. The fact that the back end was underpriced holds under all three.
III. The Stress Test of April 17
The standout day of these two months: April 17. Iran announced that night Hormuz was “fully open.” Brent fell roughly –11% intraday, from around $99 to $88. Sell-side desks calling “$130 oil” the night before flipped overnight to “war over, oil heading to $70.” Long-crude hedge funds were liquidated en masse again, and CTA models went short across the board.
Though strictly speaking, the real “everyone wiped out” day was the April 8 ceasefire. WTI –15% on the day (per Bloomberg, the largest single-day drop in nearly six years), Brent –16%. That session cleaned out the speculative WTI longs that had been chasing the rally for weeks. April 17 took out the next batch: the WTI longs who, after April 8, had bought the dip and bet “this time it’s really over.”
That night I replied the “don’t Panic Sell” tweet on X:

Same argument we’d been making for six weeks: trade the duration, not the headlines. A unilateral statement out of Tehran can’t reopen a Strait that’s been functionally closed by “Iran’s asymmetric arsenal × the global maritime insurance system.” Insurers don’t go back to a war zone on a press release. Until that changes, whatever Iran says, the Strait is closed.
The week after:
Brent rallied for seven straight sessions, back above $110+
Marine insurance for Gulf-routed VLCCs didn’t normalize
Actual transits through Hormuz barely moved
And the back end of the curve started printing new highs for this war cycle
April 17 was the cleanest stress test this framework has had. The framework held.
IV. The Back End Is Catching Up
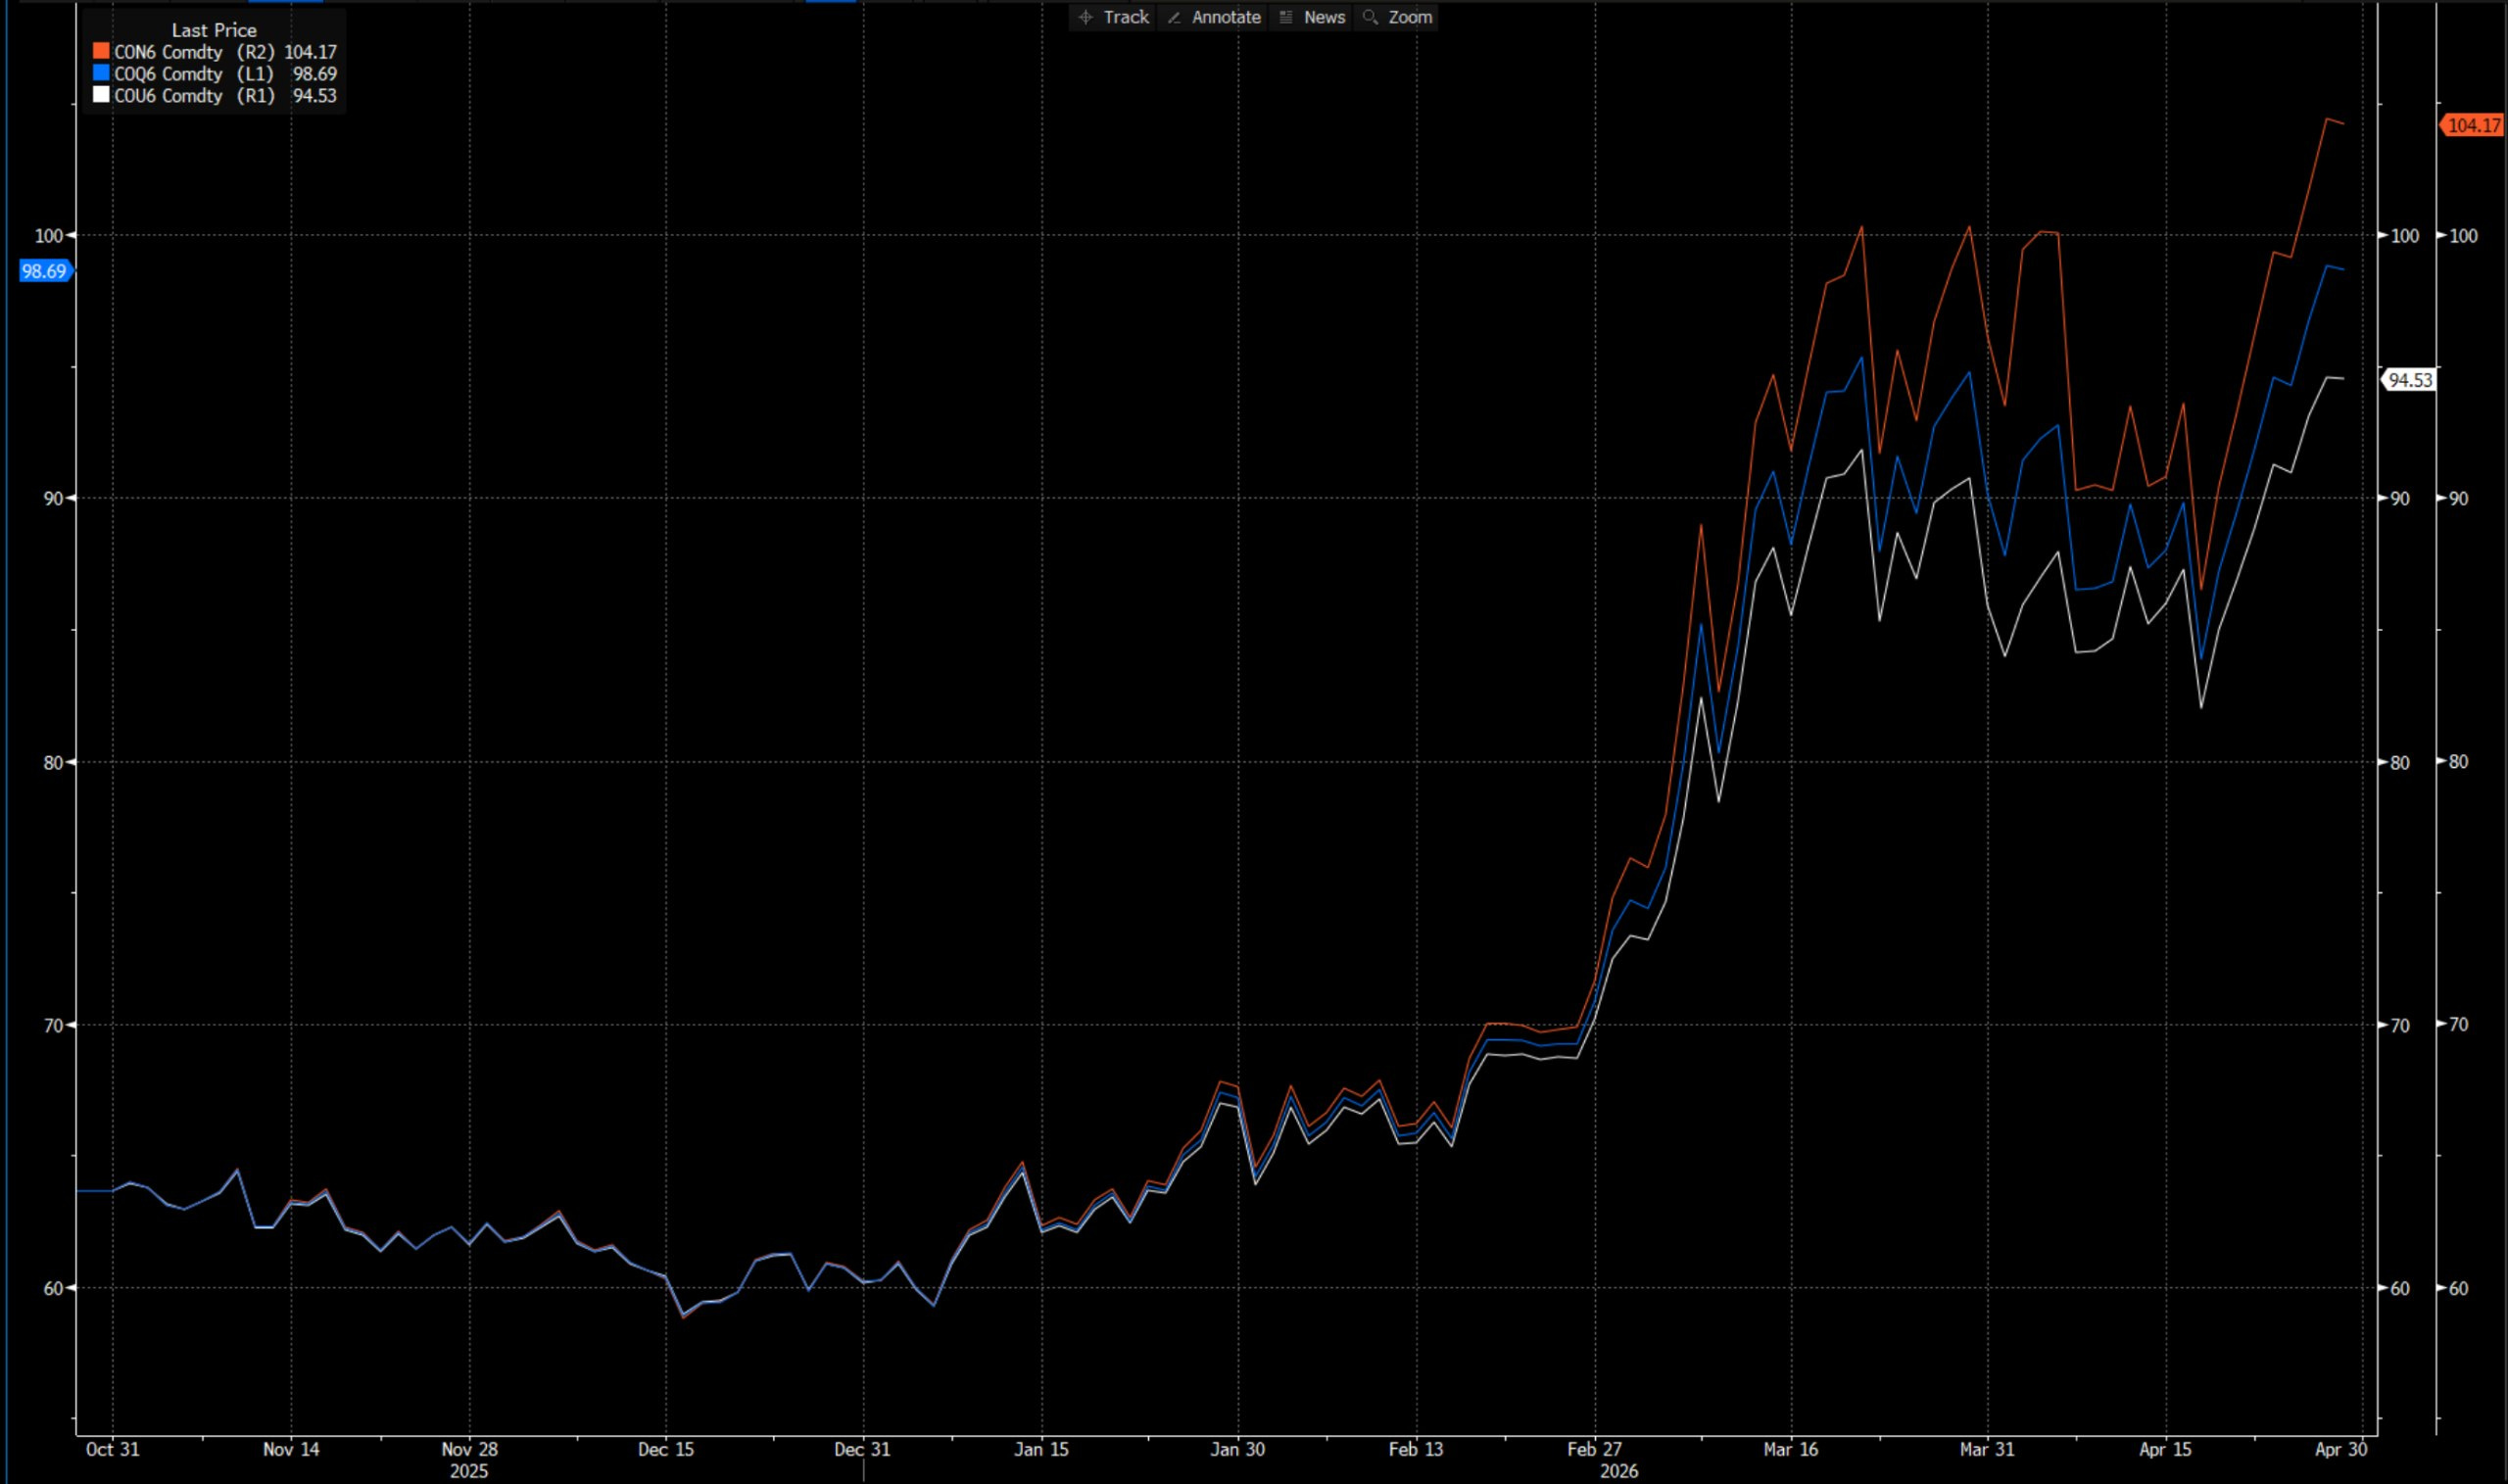
The pre-war curve was flat. From October 2025 through mid-February 2026, Jul / Aug / Sep ‘26 are basically one line. The market priced the duration risk premium across a 3-month window at zero.
Post-war, the curve fans out, in deep backwardation. A $10 spread across a 3-month window is roughly 5–10x normal.
At the far right, even the September contract is making new highs. The back end is catching up to the front. Five months from spot is no longer being treated as “post-war normal.” The market is pricing the war into Q3.
V. WTI vs. Brent: The Price Relationship Is Back
One detail from these two months that really matters when you’re picking the instrument: WTI is the speculative vehicle. Brent is the truer transmission of physical reality. And do not trade CL on crypto exchanges if you trade with size. We’ve pointed out on X why the design is broken; in any market with material futures spreads, it’s effectively untradeable for size.
At several points between March and early April, WTI traded above Brent across multiple parts of the curve. A relationship that should normally run $1–3 the other way flipped into a structural inversion. The mechanism is clear:
Hedge funds wanting to be long crude during the war piled into WTI, not Brent. WTI has deeper U.S.-domestic liquidity, easier retail futures access, and sits better in prime broker workflows.
WTI is a U.S. inland benchmark. Its direct exposure to Hormuz is smaller than Brent’s. The money flowing in is pure positioning, not physical demand.
So when ceasefire scares hit (April 8, April 17), the speculative WTI longs were the first to get squeezed. April 8’s –15% single-day move was the real choke point for that wave of WTI specs; April 17 took out the next round. After each crash, WTI clearly underperformed Brent on the rebound. That’s the cleanest evidence we have that WTI was being driven by the news cycle these past six weeks.
This week, Brent’s normal premium over WTI is reasserting itself, which in our model means the market is back to trading geopolitics.
And this spread still has room to go. WTI’s speculative premium is still bleeding out, and Brent’s backwardation is still mean-reverting.
VI. From War to Stalemate
Aside from UAE, the other big story this week: per a WSJ report, Trump is positioning the U.S. Navy’s long-term blockade of Hormuz as a deliberate strategy. Not a transitional posture. A permanent one. The logic he’s pitching: a closed Strait is a cheaper way to pressure Tehran than further escalation.
This is what we meant earlier by “the U.S. chose another path.” It doesn’t end the war. It changes the war’s shape.
It looks more like a war in a stalemate phase: no ceasefire, no resolution, no further escalation, but both sides quietly transferring costs to each other under the table, weaponizing time itself. Strait stays closed. Floor under oil prices is permanently lifted. Duration premium is permanently stretched.
For the curve: the front month doesn’t unwind quickly, and the back end has to keep climbing to catch up.
VII. OPEC / UAE Sidebar
This week’s headline: UAE will exit OPEC effective May 1. The full strategic implications go in a separate note. This is the biggest cartel-level fracture in fifty years, and this time it really is different. But for this review, only one question matters: what’s the short-term price impact?
Short-term: close to zero. Medium-term: this is the single most important downside catalyst on the curve.
Why short-term is zero: even if UAE goes flat-out from May 1, the extra barrels still have to get out of the Gulf. UAE has only one major route bypassing Hormuz, the Habshan–Fujairah pipeline, capacity around 1.5 mb/d. That pipeline is already running near full. With the Strait closed, UAE’s marginal output is structurally walled off behind that pipe. As long as Hormuz stays closed, UAE’s OPEC exit is a political event, not a physical event.
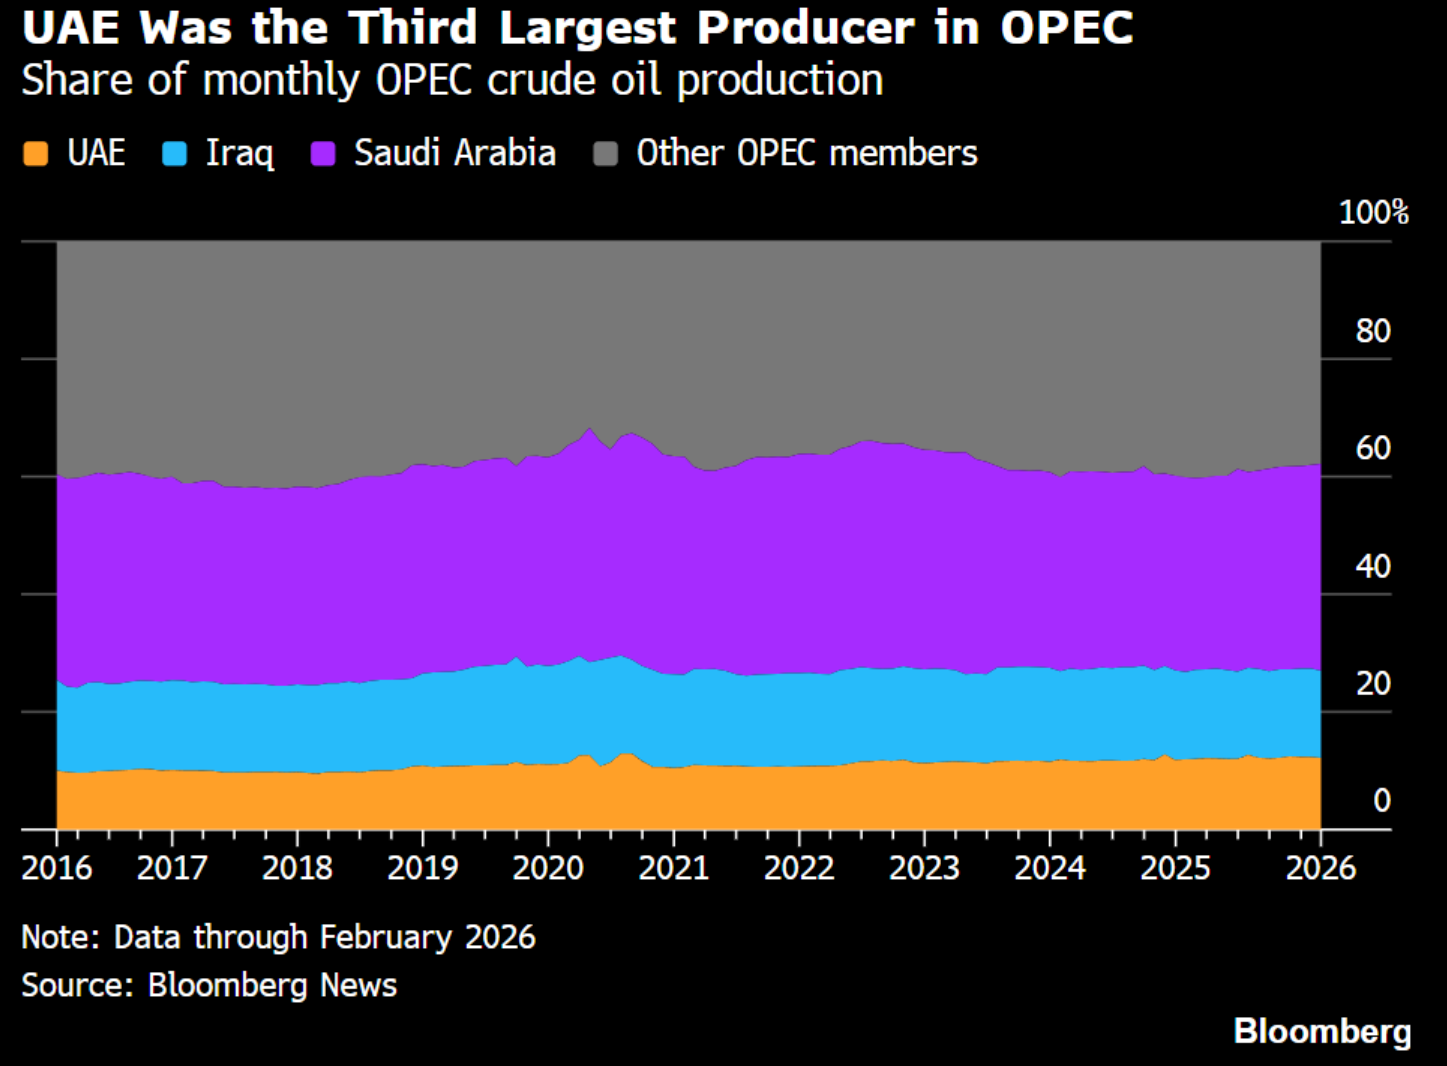
Why medium-term it matters: the moment the Strait reopens, what walks out of UAE is a world of zero quota, zero discipline, ADNOC publicly targeting 5 mb/d of capacity. That pool of latent supply is laying the groundwork for a Saudi–Abu Dhabi market-share war the curve hasn’t begun to price.
VIII. Positioning: Starting to Wind Down
Our view on Hormuz hasn’t changed. This is a long, stalemate-phase event, and the Strait isn’t reopening any time soon. But we have to admit: the crude trade is getting boring. The bulk of the duration premium we argued was warranted has now been priced in. The back end is catching up. Brent–WTI is mean-reverting. From here, we’ll be winding the trade down gradually rather than adding.
But the next trade actually worth the effort isn’t in crude anymore.
The most interesting trade over the next month should be the transmission effects of crude. Once $100+ oil sustains, the market has to start clearly pricing it into the inflation path, into central-bank reaction functions, into the rate curve, into the margin squeeze across different sectors. That’s where the real second act of this war starts. We’ll lay it out separately in upcoming Weekly Signal Playbook notes; won’t unpack it here.