
The Three-Body Problem: When AI, Debt, and War Collide
AI debt, energy shocks, and semiconductor chokepoints were supposed to be three separate trades. As of this March, they're one system. Here's what breaks first.

Signal Check · Mar 17, 2026
Stance: RISK-OFF
Key Signal: AI-sector volatility and energy-shock volatility have moved from uncorrelated to synchronized as of March 10 — the convergence phase has begun.
Confidence: 🟢 High
Invalidation: If OVX/VIX ratio compresses below 2.5 AND Brent/WTI spread narrows below $3, the convergence thesis is failing.
In physics, the three-body problem describes a system where three objects exert gravitational force on one another — and unlike two-body systems, their trajectories become fundamentally unpredictable. No closed-form solution exists. Small perturbations cascade into chaos.
Financial markets just entered their own three-body problem.
Three forces — AI-driven debt acceleration, the Iran war’s energy shock, and the fragility of the global semiconductor supply chain — have been evolving on separate timelines. For months, the market treated them as independent risk factors. That assumption is now breaking down.
As of March 10, IT-sector volatility and crude-oil volatility started moving in sync for the first time this cycle. The regime has shifted. The three bodies are now gravitationally locked.
This piece maps the convergence, shows the cross-market evidence, and identifies who gets squeezed first.
I. The Three Forces
Force 1: AI → Debt Transmission
The AI revolution is not just a technology story — it is a credit story.
Big Tech’s cash-to-total-assets ratios have been plummeting. Microsoft fell from ~50% to ~13%. Oracle sits at ~5%. The five largest AI spenders — MSFT, AMZN, GOOGL, META, ORCL — have collectively shifted from cash-rich balance sheets to debt-funded capex machines. The AI arms race is consuming their safety cushion.
This wouldn’t matter if the debt stayed contained. It isn’t.
In physics, the three-body problem describes a system where three objects exert gravitational force on one another — and unlike two-body systems, their trajectories become fundamentally unpredictable. No closed-form solution exists. Small perturbations cascade into chaos.
Financial markets just entered their own three-body problem.
Three forces — AI-driven debt acceleration, the Iran war’s energy shock, and the fragility of the global semiconductor supply chain — have been evolving on separate timelines. For months, the market treated them as independent risk factors. That assumption is now breaking down.
As of March 10, IT-sector volatility and crude-oil volatility started moving in sync for the first time this cycle. The regime has shifted. The three bodies are now gravitationally locked.
This piece maps the convergence, shows the cross-market evidence, and identifies who gets squeezed first.
The transmission chain:
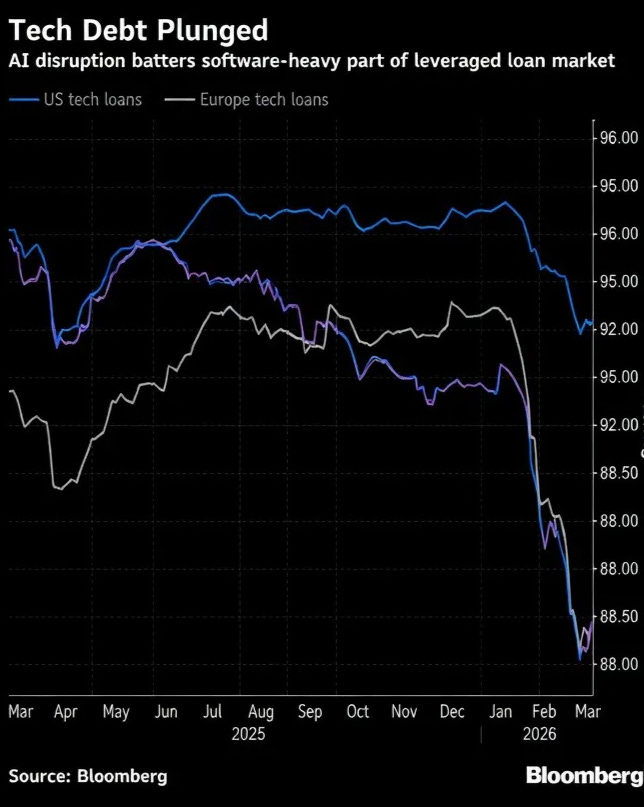
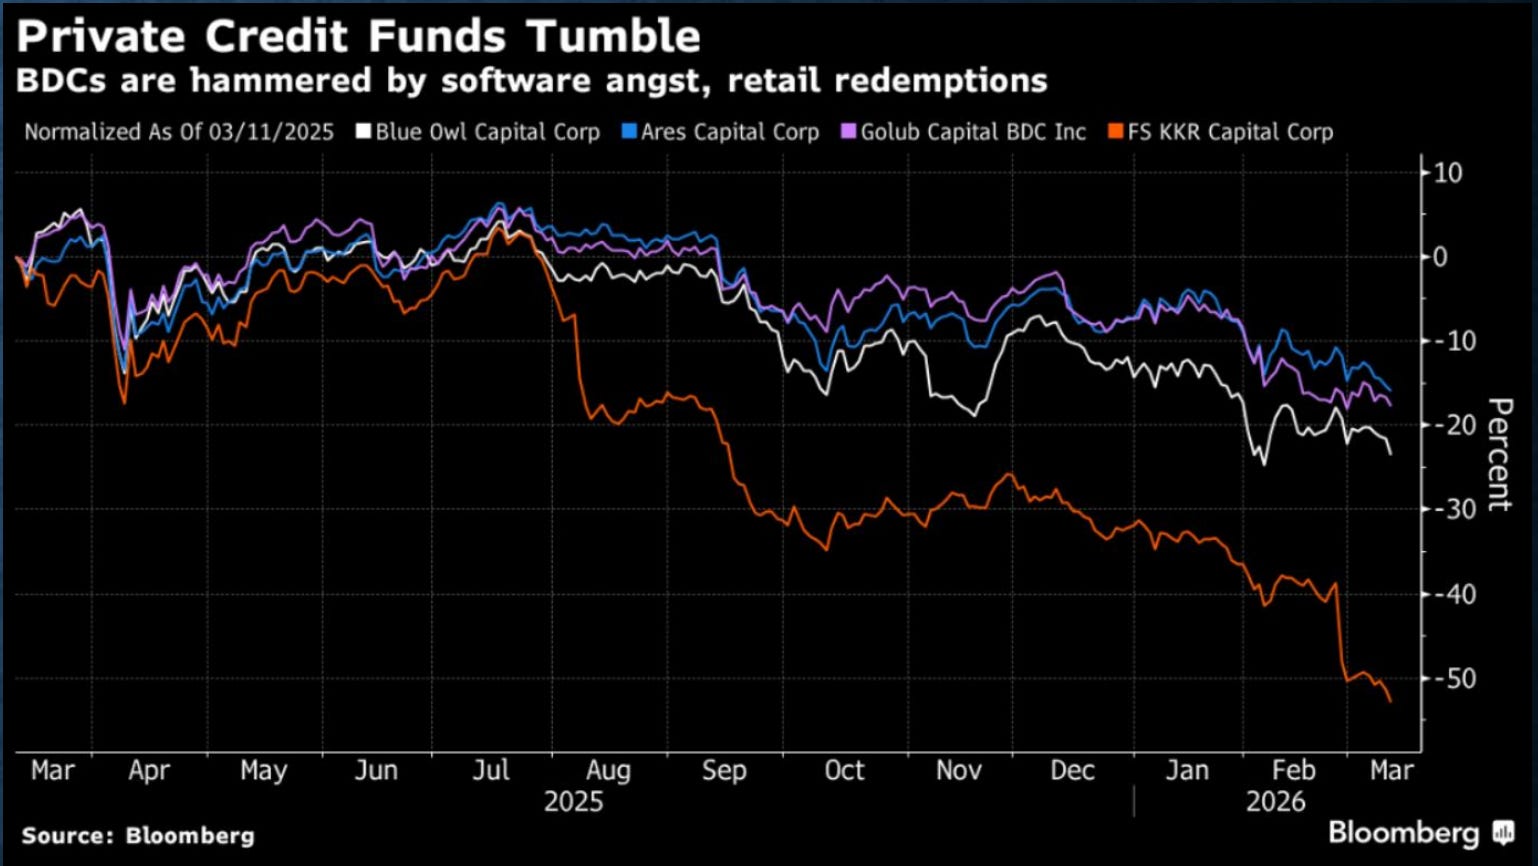
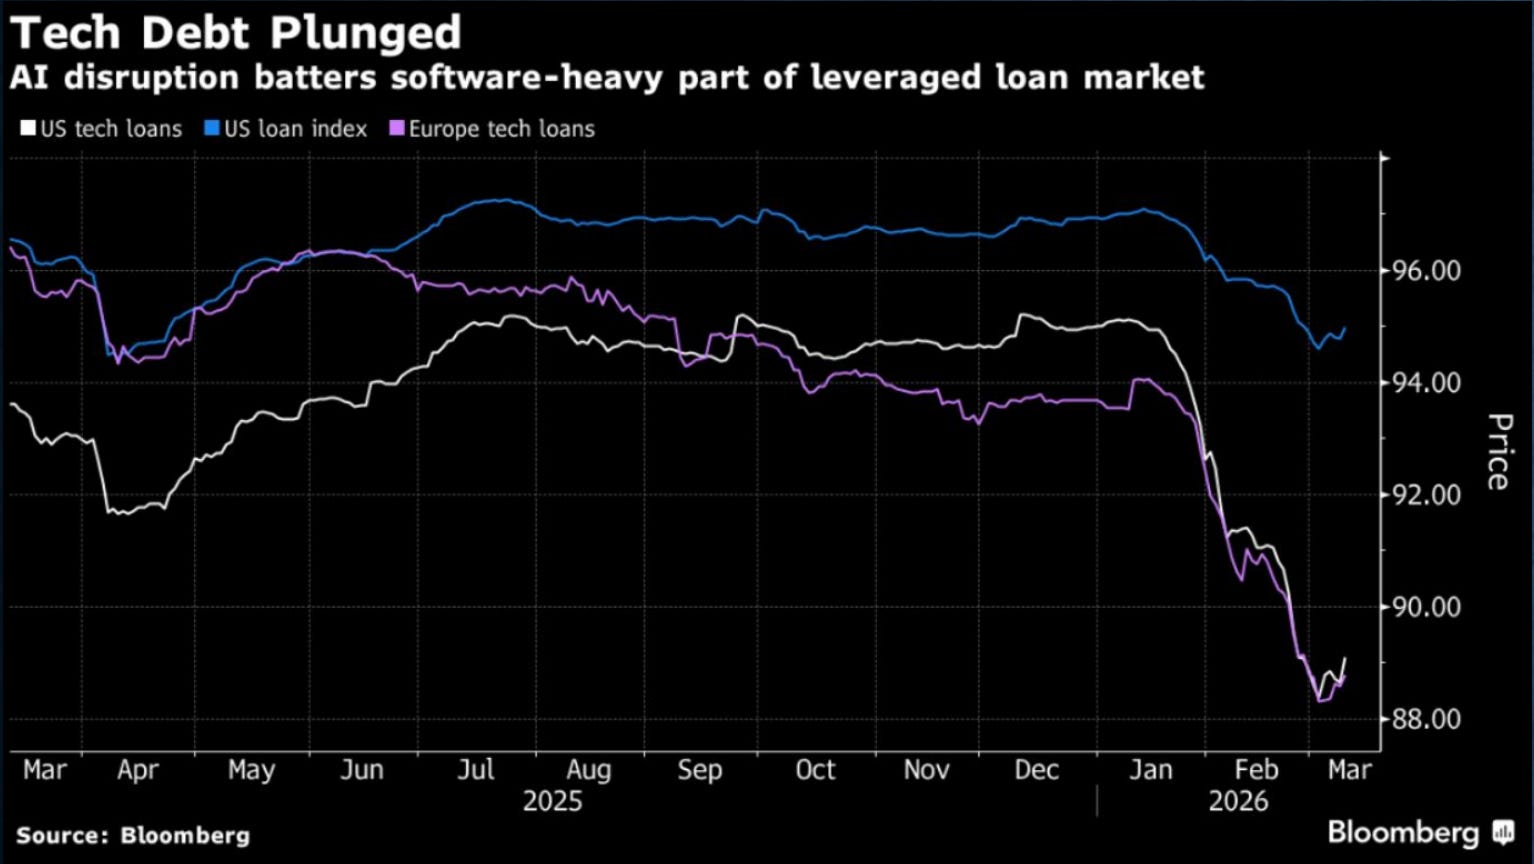
AI disrupts software → leveraged loans to software-heavy companies collapse (US/EU tech loan indices broke below ~92)
BDCs get hammered → Blue Owl, Ares, Golub, KKR funds face retail redemptions
Private credit → public contagion → negative feedback loop
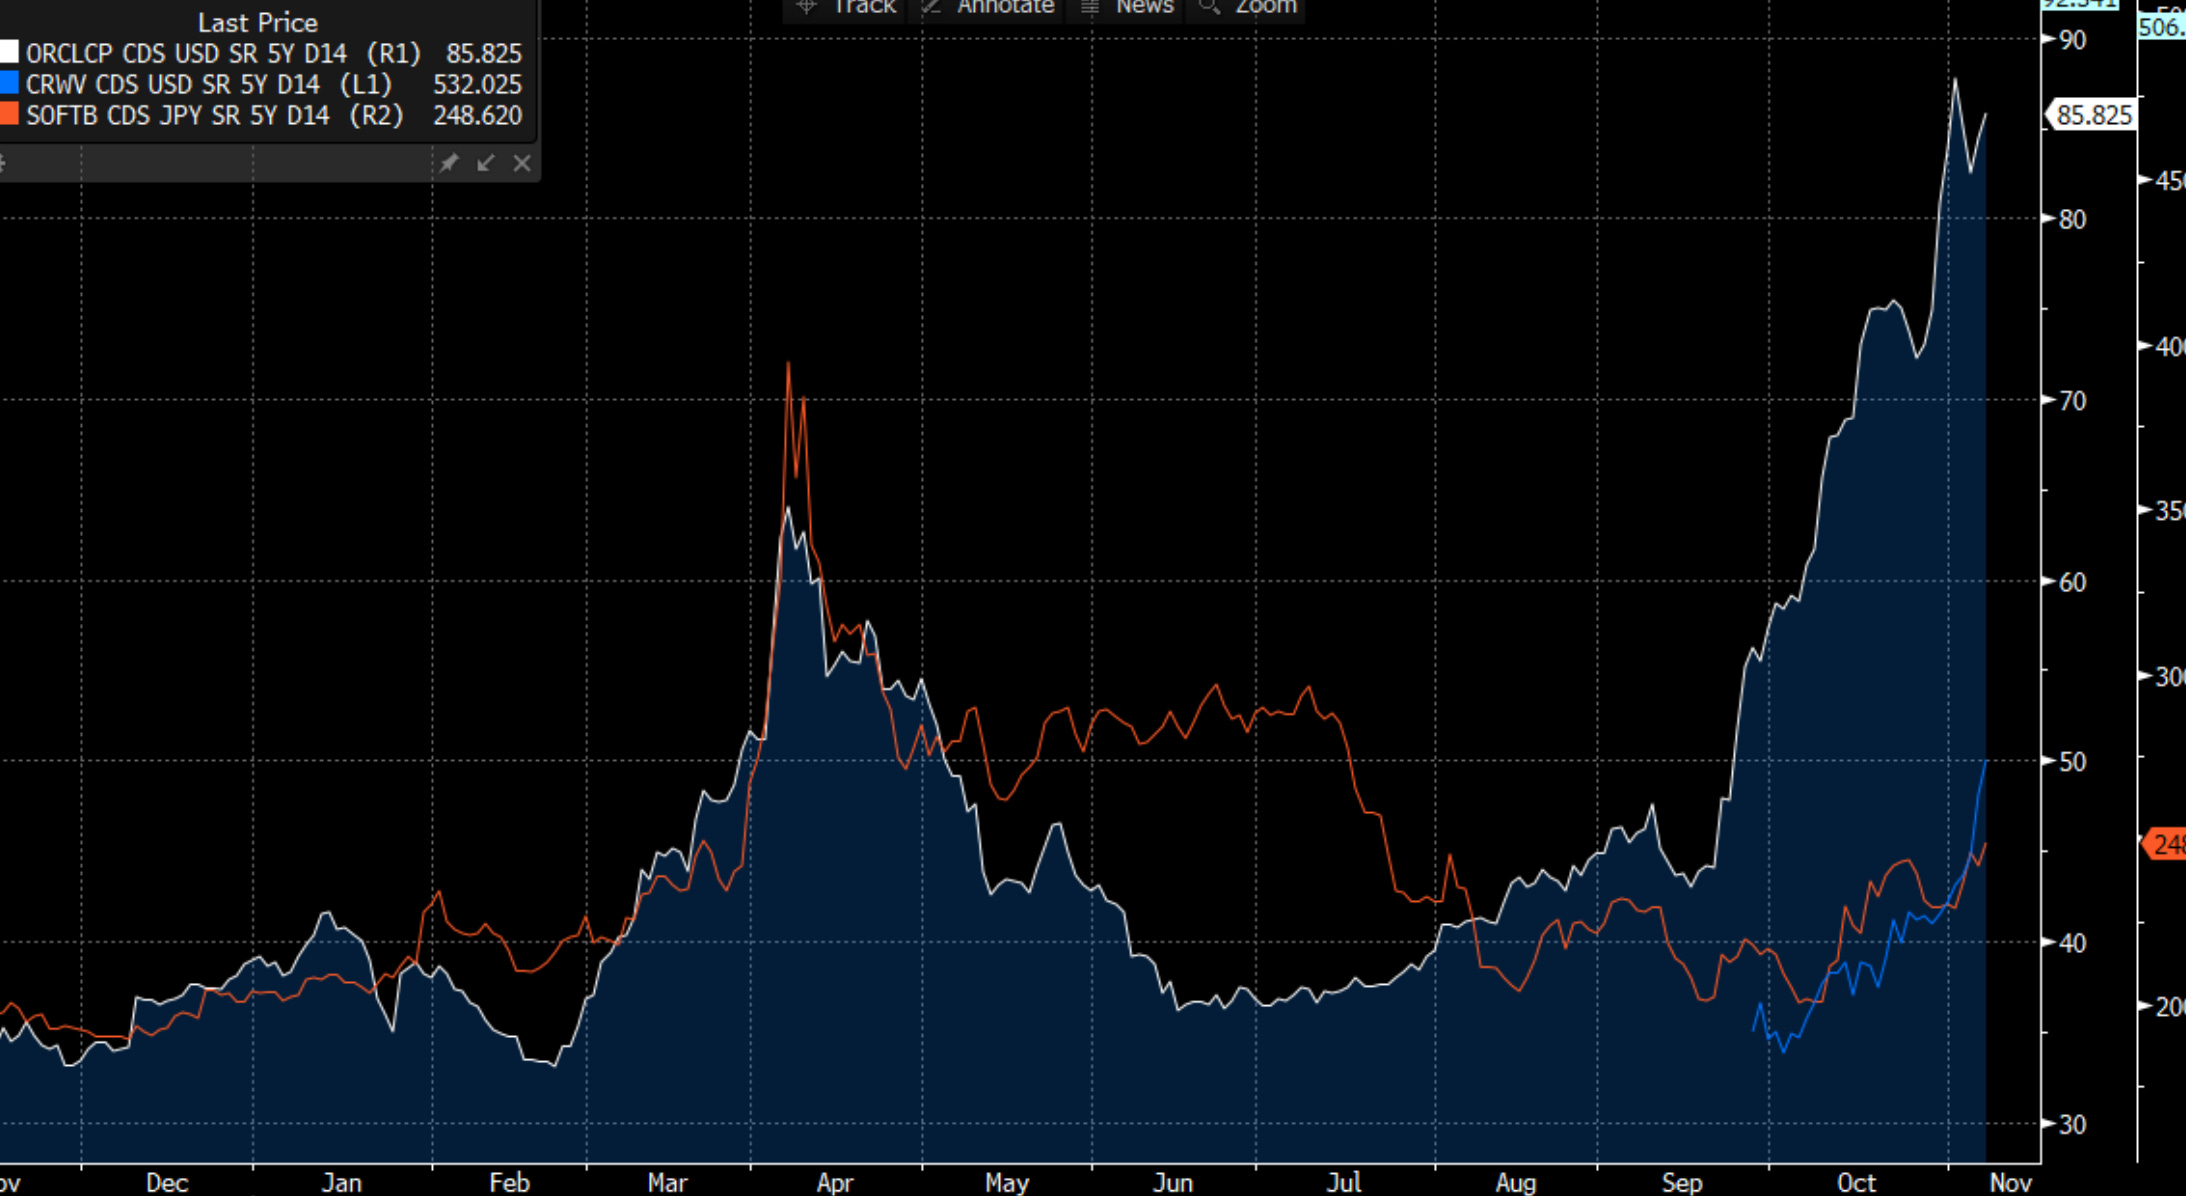
CDS spreads tell the story in real time (as of writing):
CoreWeave 5Y CDS: 532 bps (spiked above 900 in late 2025)
Oracle 5Y CDS: 86 bps and rising
SoftBank 5Y CDS: 331 bps
Big Tech aggregate CDS hit 2-year highs — but they’re still below investment-grade levels. The market consensus is “early cycle, no crisis yet.” Industry chatter says 2026 is expansion, 2027 is M&A consolidation.
That complacency is precisely the setup.
The storm’s eye is OpenAI. Morgan Stanley’s AI Ecosystem Capital Flow map shows OpenAI at the center of a $40B+ web connecting Microsoft, Nvidia, CoreWeave, and data center leases. A critical and under-discussed funding source: Middle Eastern sovereign capital. The Iran war puts that pipeline at direct risk.
AI debt is not a future problem. It is a present vulnerability with a geopolitical trigger.
Force 2: Iran War → Energy Shock → Inflation Loop
Forget the binary “war on / war off” framing. The real pricing variable is duration.
Year-to-date, Brent’s rally has already exceeded the 2022 Russia-Ukraine war spike. But the supply dynamics are structurally worse this time:
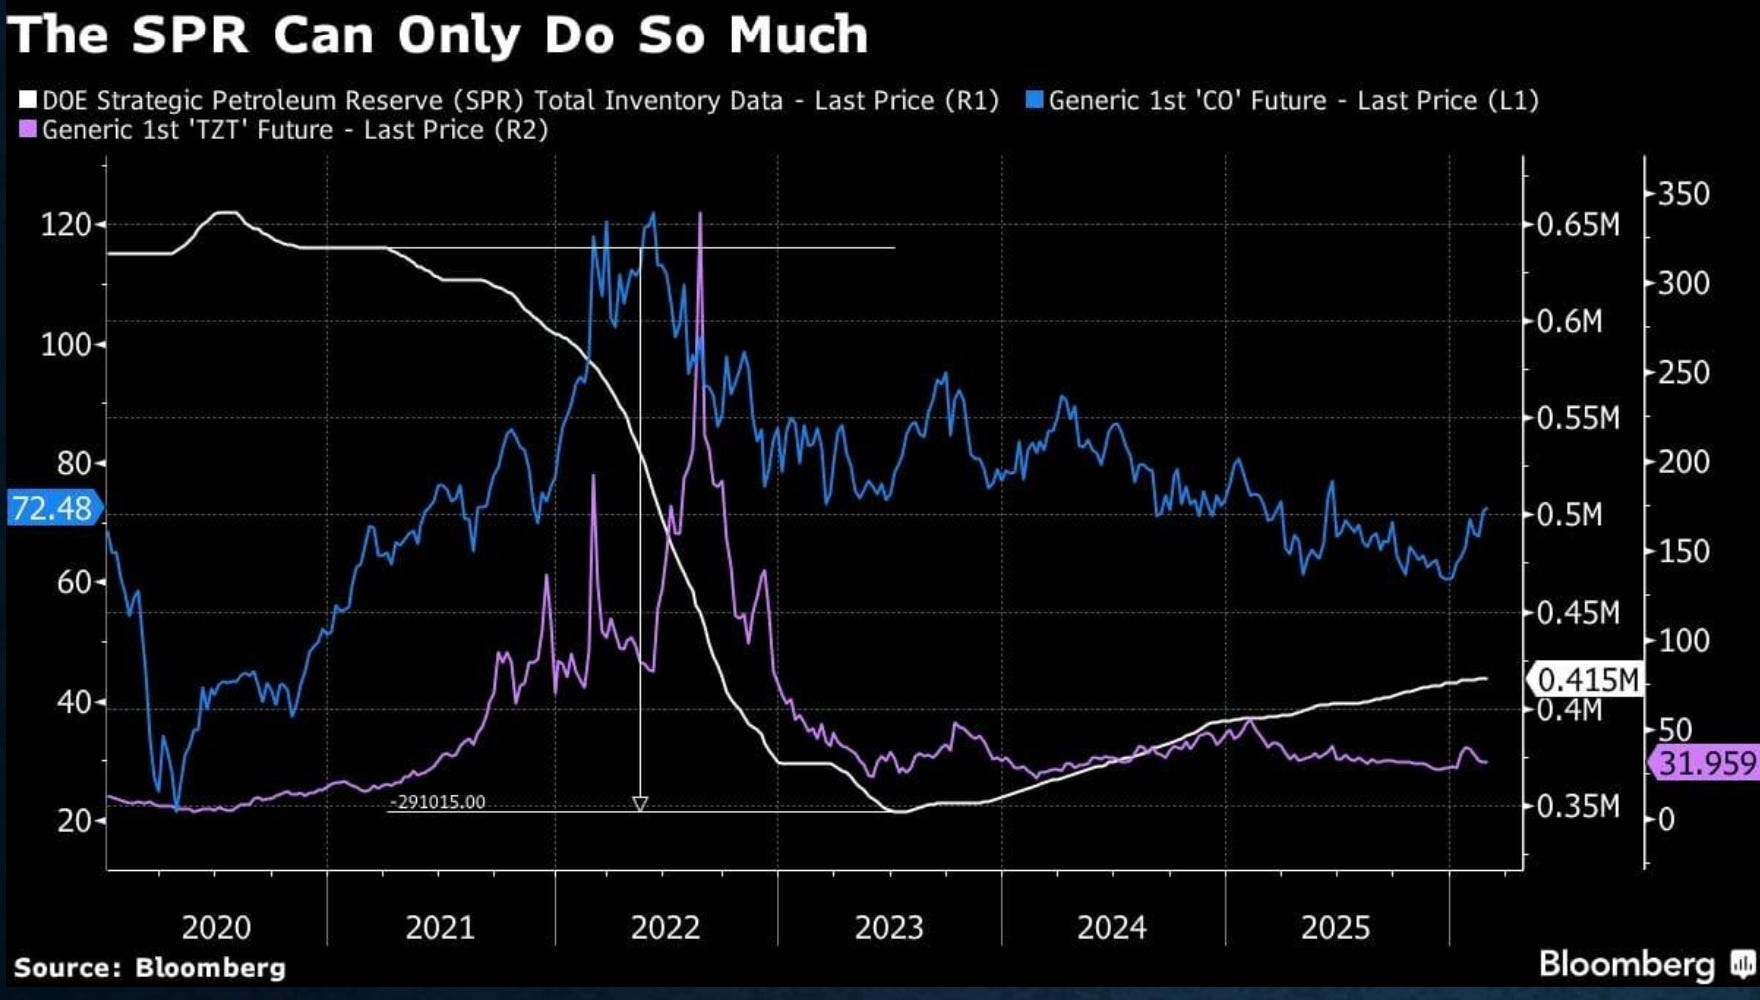
2022: US expanded production, deployed SPR releases, manufactured fake ceasefire headlines to buy time, and ultimately crushed Russian crude prices through supply diversion.
2026: Middle Eastern spare capacity is depleted. OPEC has been cutting. Restarting production takes ~2 months minimum. US SPR is at historic lows (~415M barrels, near a 40-year low). The same playbook cannot run again.
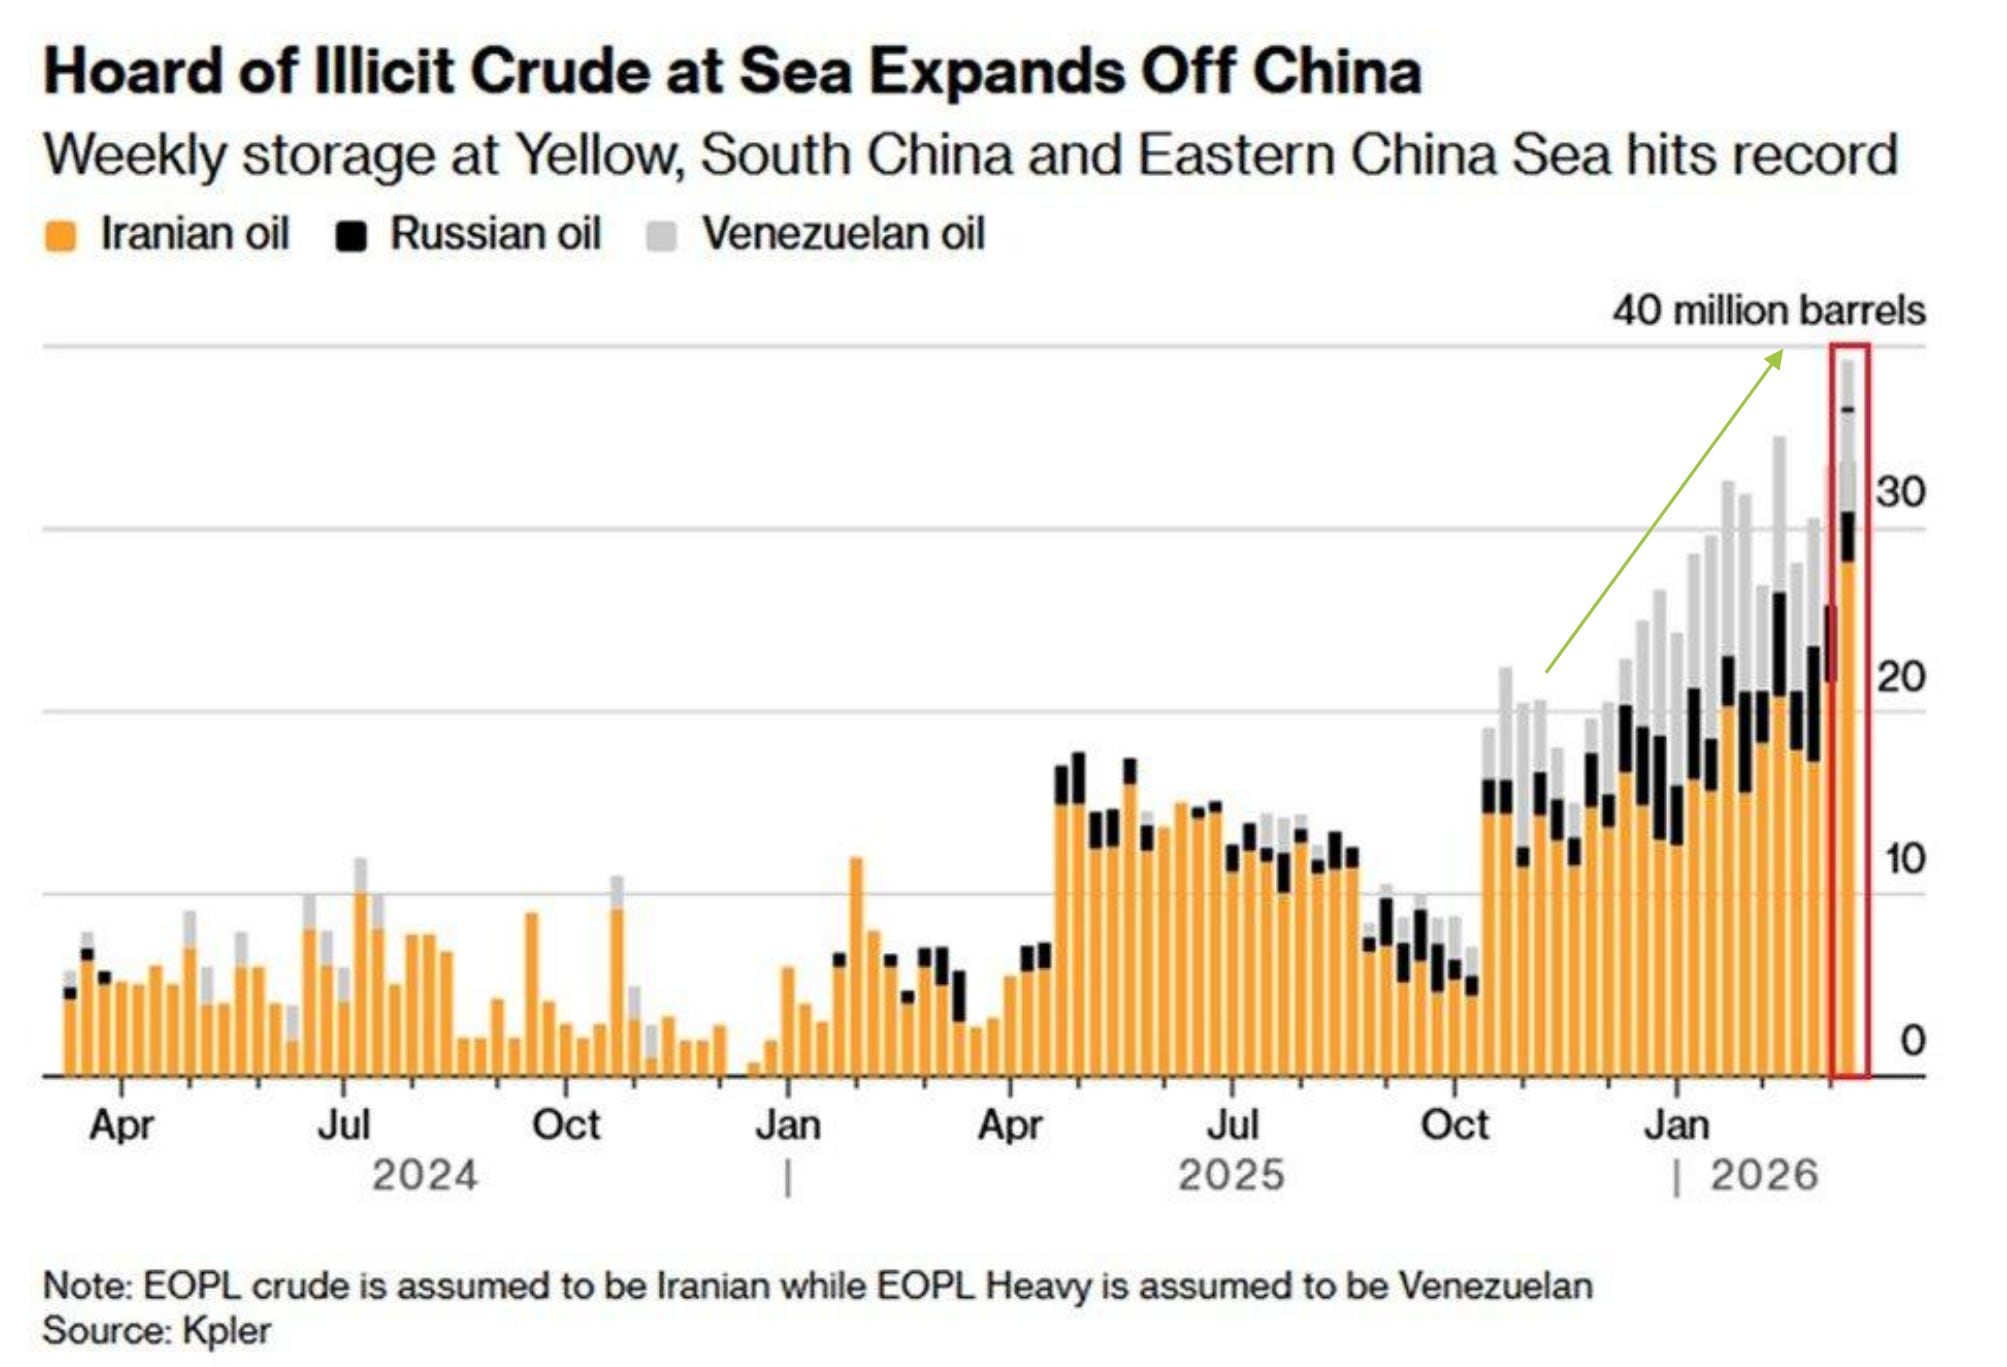
Meanwhile, China is playing a completely different game. A record 39.3 million barrels of sanctioned crude are anchored off China’s coast — 77% Iranian, stored in the Yellow Sea and South China Sea, feeding teapot refineries. This is not passive accumulation. This is strategic energy stockpiling during a war that China did not start but intends to profit from.
The crude oil / US Treasury ratio (WTI / CBOT 10Y) has hit new highs — energy inflation is actively eroding bond returns. The transmission is live: Oil → Inflation → Rates → Debt servicing costs → Back to Force 1.
Force 3: Semiconductor Chokepoints → Systemic Fragility
The chip supply chain is the gravitational constant binding the other two forces — and the feedback loop that makes the system truly unpredictable.
The AI physical stack is deeper than most investors realize. The market talks about chips, but the real dependency chain runs: GPU → power → self-built power plants → grid infrastructure → energy storage (lithium carbonate) → cooling systems. Every layer depends on stable, cheap energy. AI is not a software bet — it is an energy-intensive industrial complex disguised as a technology trade.
And the energy demand is only growing. Bloomberg/Morgan Stanley’s AI investment forecast shows the market shifting rapidly from Training to Inference, with total addressable market projected to exceed $800B by 2032. Inference is more distributed, more continuous, and more energy-hungry per unit of revenue than training. The energy bill for AI doesn’t plateau — it compounds.
Taiwan’s electricity generation mix: ~47% natural gas, ~31% coal, with minimal oil. A Hormuz Strait disruption doesn’t just spike crude — it threatens the physical production capacity of the world’s most critical semiconductor foundry.
The WTI / TWD (Taiwan Dollar) correlation is running near historic highs. When oil spikes, Taiwan’s manufacturing cost base spikes with it. TSMC’s monopoly position in advanced AI chips means this isn’t a local risk — it’s a global systemic node.
Hormuz energy dependency by country:
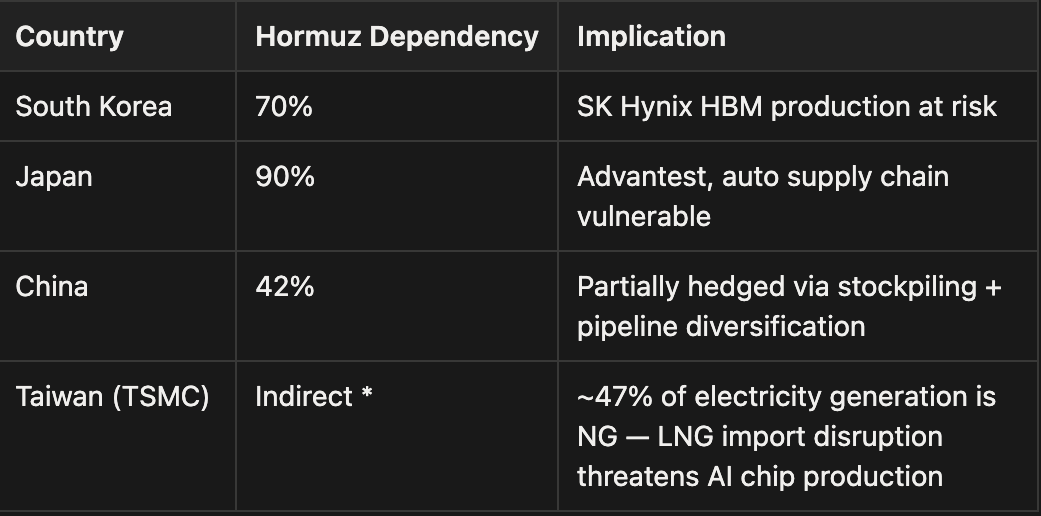
Meanwhile, the semiconductor supply chain is being quietly weaponized by geopolitics. Reports indicate South Korea is tolerating HBM smuggling operations and Samsung advanced-node “underground” foundry work for China — in exchange for Beijing’s tacit acceptance of the Korea-US alliance. The chip supply chain is no longer governed purely by market logic. It is being carved up by political deals made in the shadows.
The Intel/TSMC ratio has collapsed to ~0.08 — an all-time low. The market is pricing TSMC’s dominance as permanent and unassailable. That’s also pricing zero probability of a supply disruption. One of these assumptions is wrong.
Here is the critical feedback loop that closes the three-body system: Energy shock → chip production constrained → AI capex ROI deteriorates (same spend, less compute) → Big Tech debt burden worsens with declining returns → CDS spreads widen → back to Force 1. The semiconductor chokepoint doesn’t just passively absorb risk from the other two forces — it actively amplifies and transmits it back. This is why the system is nonlinear.
II. The Convergence: When the Bodies Lock
Here is the critical timing observation that changes everything.
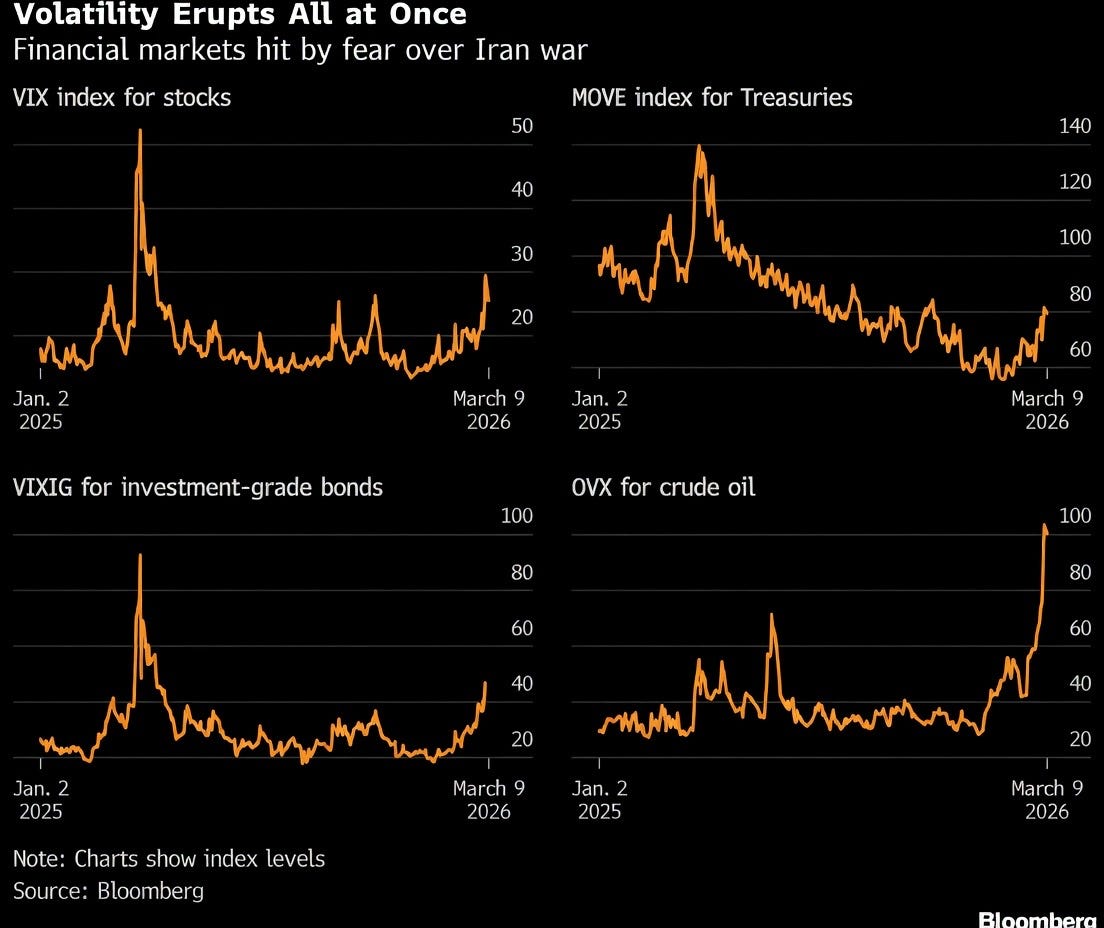
From February 23 to March 9, AI hardware/software rotation drove IT-sector volatility independently — it was not correlated with the energy shock. The market treated them as separate trades.
Starting March 10, IT and energy volatility synchronized.
This is the phase transition. When two previously uncorrelated volatility streams begin moving together, the system’s total risk doesn’t add linearly — it multiplies.
The OVX/VIX ratio (crude oil volatility / equity volatility) currently sits at ~4x. That’s anomalous. Either:
Oil volatility is overpriced relative to equity risk, OR
Equity volatility has not yet caught up to the true geopolitical risk premium
Given the convergence evidence, we believe the latter. VIX is underpriced.
A note on the metaphor: the three-body problem in physics implies no closed-form solution — the path is unpredictable. We are not claiming to predict the path. But the direction of risk is assessable even when trajectories are not. All three forces push the same way: higher volatility, wider spreads, tighter liquidity. The uncertainty is in timing and sequence, not in sign.
The market is running two separate risk models for what is now a single, interconnected system. That gap is the opportunity — and the danger.
III. Cross-Market Evidence: The Signal Grid
Our framework requires every thesis to be verified across at least two independent markets. Here’s what the cross-asset grid is showing:
Oil / Treasuries: Inflation Is Winning
WTI / 10Y UST ratio at cycle highs. Energy inflation is eating fixed income alive. Real yields are structurally negative for anyone holding duration.
Brent / WTI Spread: Geopolitical Premium Is Real
Brent-WTI spread widened to +$7.77. International crude is tighter than US crude — the Hormuz premium is being priced into the Atlantic Basin but not yet into US equity vol.
SC-WTI Spread: China’s Import Cost Is Exploding
Shanghai crude (SC) vs WTI divergence has gone parabolic — from -18 to +215. Sanctions, shipping risk, and RMB pressure are compounding. China’s teapot refineries are the canary.
QQQ / EEM: US Tech Premium Is Fading
The Nasdaq/EM ratio has rolled over from ~12.8 to ~10.3 — US tech’s relative outperformance has peaked. The AI debt overhang and energy cost transmission are eroding the Nasdaq premium. Meanwhile, EM capital flight is accelerating, which means neither side of the ratio offers safety. The divergence is narrowing, but through mutual destruction rather than EM recovery.
BYD / Volkswagen: The EV Power Shift
BYD/VOW3 ratio surged from 0.45 to 1.60 before pulling back — the structural shift in global auto is irreversible. China’s EV offensive is crushing legacy European automakers. This is not cyclical. It’s existential.
Europe-US Volatility Spread: Room to Widen
Oil shocks hit European volatility harder than US volatility — the spread has room to rise, especially given European valuations have barely reset since the war began (3σ de-rating still not fully corrected).
IV. Who Gets Squeezed
Europe: AI + Energy Double Compression
Europe faces a uniquely painful combination:
AI competitiveness gap — falling behind in tech, internet, and innovation; talent and capital flowing to US and China
Energy cost shock — post-Russian gas ban leaves Europe dependent on expensive US LNG; oil spike compounds the pain
Earnings erosion — European earnings estimates have been cut consistently since March; the bar for beats is already on the floor
Manufacturing exodus — high-end manufacturing migrating to China; imports from China expanding
This is not a dip to buy. This is structural degradation.
India: The Forgotten Casualty
India faces an AI + oil double hit that almost no one is discussing:
AI disruption → white-collar IT outsourcing jobs at existential risk
Oil import dependency → cost base exploding with zero domestic offset
S&P 500 / Nifty 50 ratio has been grinding higher — the US is pulling away
China: The Asymmetric Beneficiary
China is not immune to the energy shock — but it’s better positioned than anyone else to benefit from the second-order effects:
Strategic oil stockpiling (39.3M barrels offshore) provides a buffer
New energy exports (solar, wind, EVs, batteries) benefit from the global push away from fossil dependency
PetroChina / MSCI Asia ratio at multi-year highs — energy sector outperformance
RMB internationalization benefits from dollar credibility erosion
Military-industrial complex is scaling faster than the US can respond (155mm production already exceeds NATO)
The geopolitical chessboard is tilting. The Iran war is not hurting China — it’s accelerating China’s strategic position.
V. Trump Has No Good Options
This is perhaps the most underappreciated element of the current regime. There are three theoretical paths — and none of them lead to a clean outcome.
Path A: Back Down
Short-term suppression of asset volatility
But the political cost is existential — Democrats frame it as weakness; career risk rises
Long-term: the petrodollar framework fractures
Investment in AI and manufacturing declines
US equities fall
US Treasuries fall
USD weakens
Malignant inflation sets in
Net result: geopolitical failure — credibility discount reprices across all US assets
Path B: Quick Victory — Not Possible
The market’s base case — a swift, decisive strike followed by de-escalation — does not exist. Here’s why:
Iran has no exit ramp. Israel’s objective is regime elimination. Trump refuses to recognize Iranian leadership. China and Russia offer no long-term guarantees. Iran has nothing to negotiate with and nothing to lose.
Iran has the will and the tools. Financial warfare capabilities, asymmetric retaliation options, and proxy networks remain intact.
The coalition is cracking. Russia has declared willingness to intervene. Spain and Italy have publicly condemned the operation. Cyprus has banned the use of its military bases.
The arsenal is insufficient. The Pentagon’s own assessments flag air defense missile inventory shortfalls. Zelensky has warned that Ukraine’s missile stocks are also depleted — NATO’s supply chain is stretched across two theaters.
Path C: Long War
Oil keeps rising
Inflation keeps rising
US debt accumulates
Default risk rises as debt servicing costs compound
US equities enter a sustained selloff
A ground war scenario would dramatically increase the certainty of all of the above
Every path leads to elevated volatility and structural dollar pressure. The question is not whether risk reprices — it’s when and how fast.
The 2025 tariff playbook (250% tariff → 2-day reversal) and the 2026 oil playbook (”100-day war” → 3-day walkback) reveal a pattern: Trump uses volatility as a tool. The market has learned to fade the initial shock. But what happens when the shock is real and cannot be walked back?
VI. What We’re Watching Next
OVX/VIX ratio — If it stays above 3.5, equity vol is still underpriced
Brent/WTI spread — Widening = geopolitical premium intensifying
Big Tech CDS — Watch for the jump from “elevated” to “investment-grade breach”
SC-WTI spread — China’s import cost canary
TSMC energy supply chain — Any disruption signal here is a global systemic event
Tail Risks to Monitor
TSMC / Samsung energy shortage → AI chip production decline, global supply chain seizure
Netanyahu assassination → both sides claim victory, off-ramp appears → rapid de-escalation scenario
Israeli defeat → nuclear escalation → extreme tail with unmodelable consequences
Iran capitulation → war ends, but US sanctions regime tightens permanently — China loses access to discounted Iranian crude, accelerating the decoupling of Eastern and Western energy markets
What the Paid Playbook Covers This Week
Free readers get the signal. Paid members get the system.
This week’s Weekly Signal Playbook includes:
Full long/short macro portfolio with specific triggers for each position
Sizing framework: how to weight conviction across the three forces
Invalidation matrix: exactly what would make us change our stance on each trade
Cross-market radar update log: we track in real-time as events develop
Regime shift probability table: quantified scenario analysis
This analysis is part of Garrett’s Signal — a global macro and digital asset research operation built on cross-market verification, institutional-grade frameworks, and built-in accountability. Every call comes with an invalidation condition.
No news. No noise. Just signal.