
Weekly Signal Playbook · Apr 23 — The Music Is Still Playing
War, Oil, and the Music That's Still Playing — 12 Active Positions, Full Framework Update

Paid subscriber content — This is the full Weekly Signal Playbook with trigger conditions, position sizing, and invalidation matrix.
Updated Apr 23. Markets are pricing peace. Oil is repricing. Bonds are siding with oil.
The Music Is Still Playing
Brent crude is at $103 today. The S&P 500 is at an all-time high.
Just weeks ago, hedge funds were aggressively shorting everything. Goldman Prime Brokerage data showed short-selling outpacing long-buying at a 7.6:1 ratio in March — the fastest global net selling in 13 years. Citi reported institutional short interest on S&P 500 names at a three-year high. Jefferies flagged record short share counts across US-listed ETFs.
Then the ceasefire headline dropped. Goldman’s “most shorted” basket of 50 stocks surged 7.1% in a single day — more than double the S&P’s move. This was an epic short squeeze, not a conviction bid. Sentiment flipped from extreme fear to extreme greed in a matter of days.
Now CTAs (trend-following funds that trade based on price momentum models) are pouring record capital into US equities. The Mag 7 have bounced 20% from their March 30 lows. The Nasdaq just posted its longest winning streak since 1992. Early Q1 earnings are strong. There are plenty of reasons for the music to keep playing.
But the assumptions behind this rally — Hormuz reopens, oil falls back, inflation cools, the Fed cuts — show no signs of coming true.
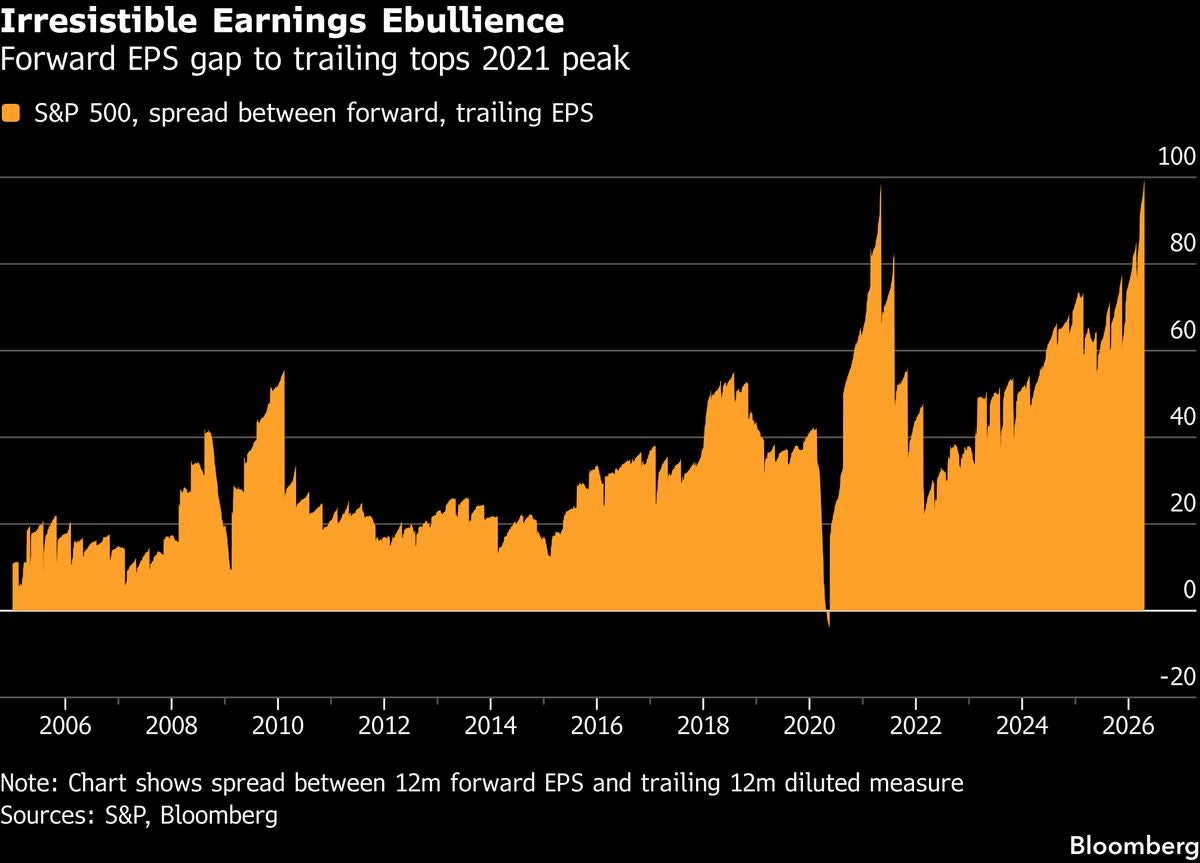
The orange area shows the spread between S&P 500 forward EPS (next-12-month expected earnings) and trailing EPS (past-12-month actual). A wider gap = greater optimism about future earnings growth. This spread has now reached its 2021 peak — last time, the 2022 bear market followed. Not a prediction, but a signal: when optimism is at extremes, the snapback when expectations roll over tends to be proportionally severe.
Oil and War
Last weekend’s 48-hour farce was a perfect illustration of why Hormuz has no solution.
April 17 (Friday): Iran announced Hormuz was “completely open.” Brent crashed 9% to ~$90. Markets celebrated.
April 18 (Saturday): Less than 24 hours later, the IRGC opened fire on tankers and broadcast “any vessel will be destroyed.” At least 9 tankers made U-turns. The strait shut again.
April 20 (Monday): The US seized an Iranian cargo ship. Brent +8%.
April 22 (Wednesday): The ceasefire expired. Vance cancelled his Pakistan trip. Trump unilaterally extended the ceasefire. Iran’s response: unclear.
April 23 (Thursday — today): Iran’s IRGC fired on three vessels in the strait and seized two of them. A two-way blockade is now in effect: the US blocks Iranian ships, Iran blocks everyone else. Brent is back at $103.
This is not a surprise. It is what Hormuz looks like. As we argued weeks ago in Hormuz Is the Battlefield : the strait isn’t closed by a physical wall. It’s closed by the deadly combination of Iran’s cheap asymmetric weapons and the rational retreat of the global shipping insurance system. The irreplaceable supply gap of 14–16 mb/d (net disruption out of ~20 mb/d total strait transit, after shadow fleet flows and alternative routing) is the largest energy disruption in human history.
Even if a ceasefire is signed tomorrow, supply cannot recover quickly. Insurance rebuilds and shipping restarts alone take weeks — we’ve been making this point since issue one; regular readers know the drill. But here’s the part the market is still underpricing: seven weeks of war have caused massive physical destruction to energy infrastructure. Israel bombed South Pars (Iran’s largest gas field). Iran’s retaliatory strikes hit Qatar’s Ras Laffan LNG hub, UAE aluminum smelters, Kuwaiti tankers, and port facilities across the Gulf. These aren’t valves you turn back on. They need to be rebuilt, repaired, and recommissioned — on timelines measured in months, sometimes years. Even if the strait reopens, physical production capacity will lag far behind shipping recovery. The supply that’s been lost is gone.
Hormuz has no solution. Duration will catch up. Commodity traders booked $20–30 per barrel in Q1 profit — normal levels are measured in cents. That number alone is the most direct proof of the duration thesis. $103 is not “high.” Dated Brent (the spot price for actual physical cargoes, as opposed to futures contracts) hit $144 in early April. Futures are being artificially suppressed $15–20 by financial markets pricing in peace that doesn’t exist. Below is a chart showing different oil prices as settlement on April 15th.
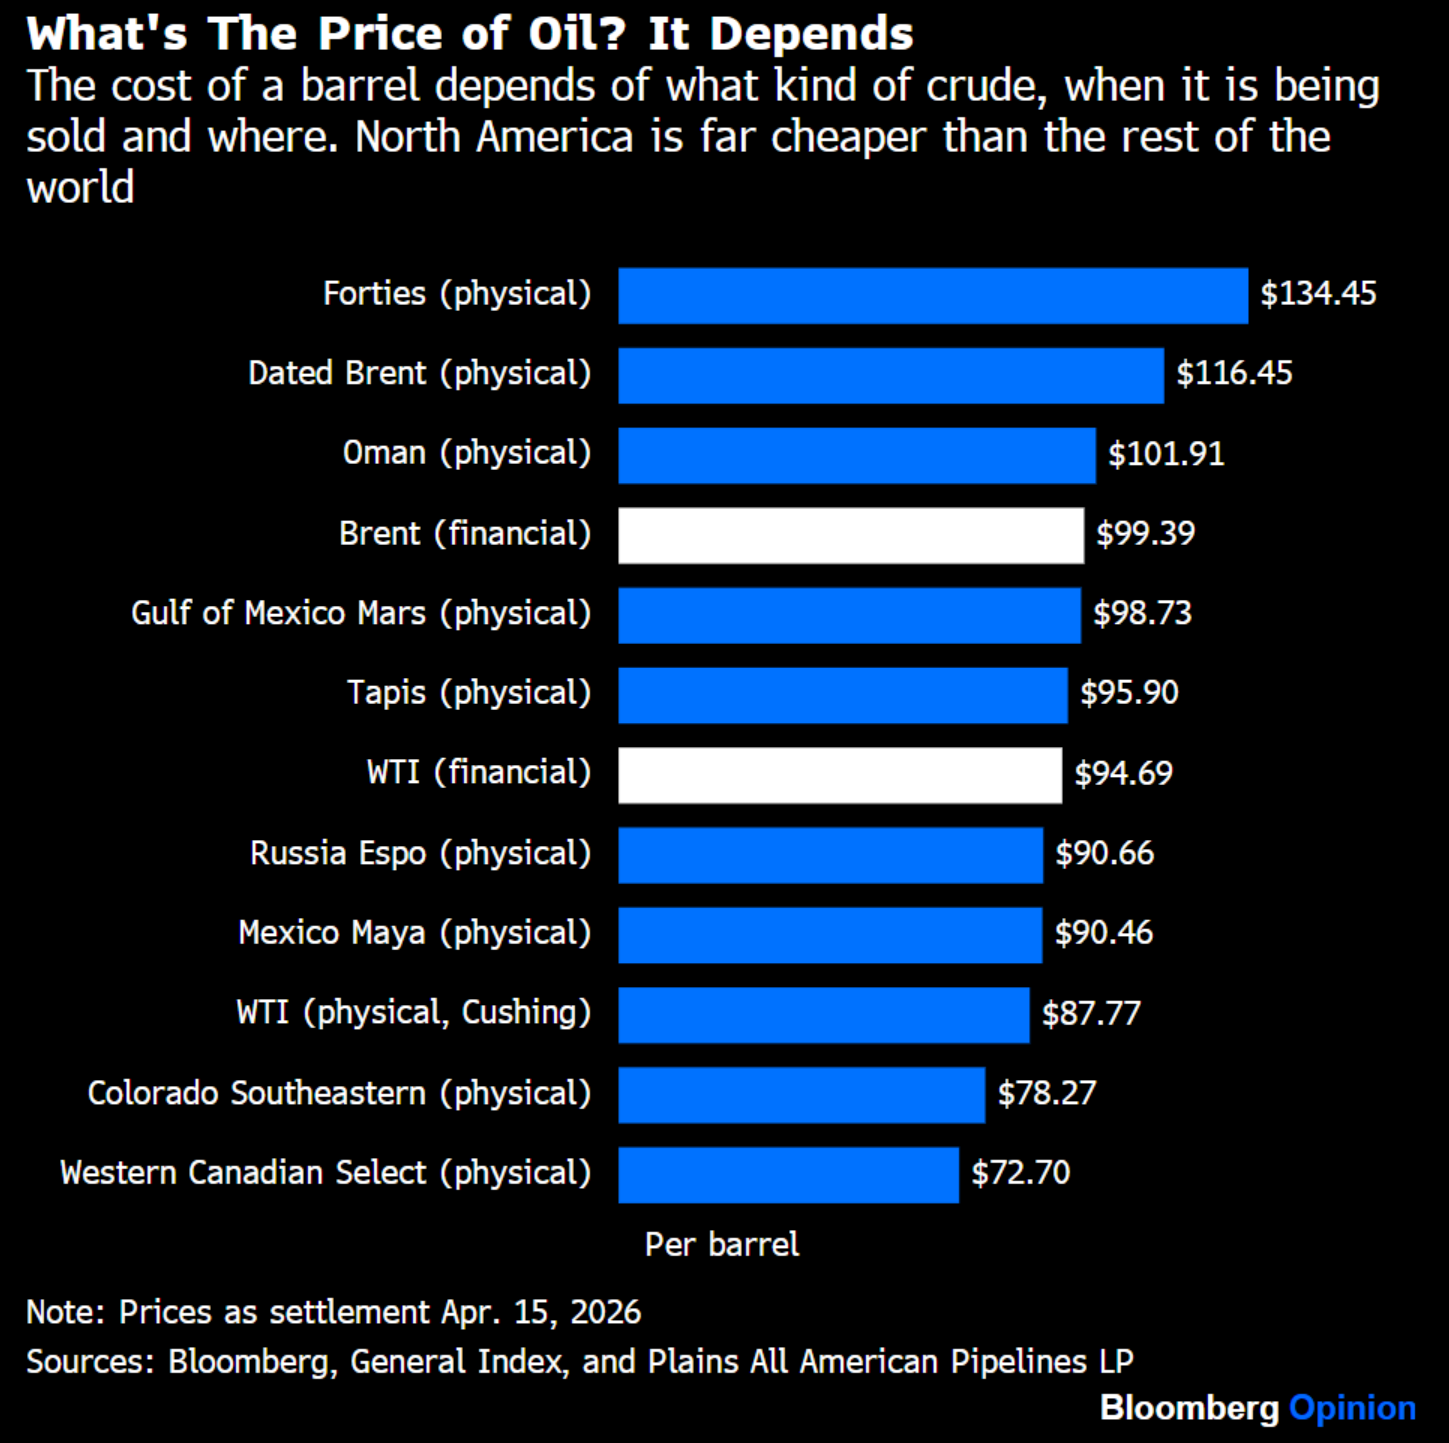
Note the ~$17 gap between Dated Brent (physical delivery, $116.45) and Brent financial (futures, $99.39) — direct evidence that futures are being suppressed $15–20 by peace expectations, as argued above. North American crude (WTI Cushing $87.77, WCS $72.70) trades far below international physical prices, explaining why the US domestic economy absorbs less damage than Europe or Asia.
Core View This Week
The music is still playing.
The gap between physical markets and financial markets has hit its widest level since the war began. Oil is starting to price in a blockade that could last months. Risk assets are pricing a world where Hormuz reopens in two weeks.
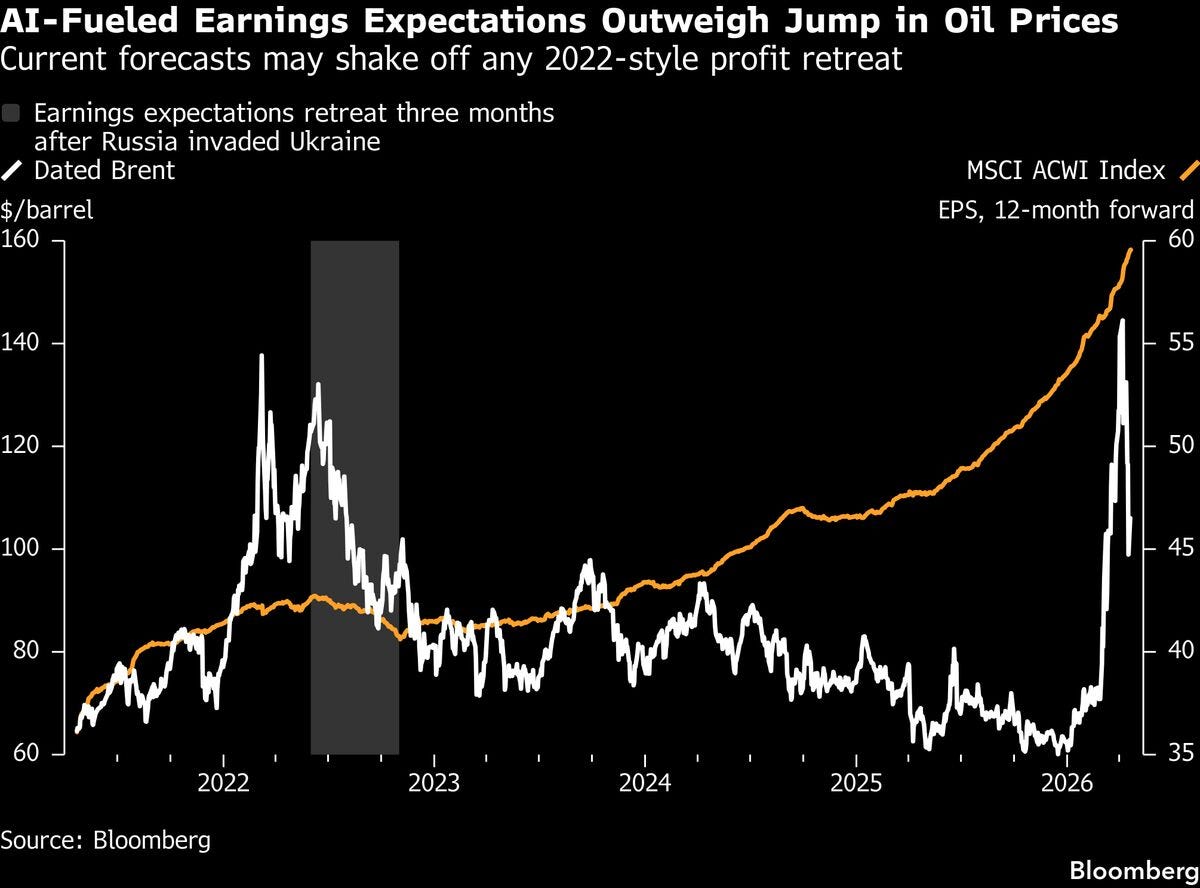
White line: Brent crude (left axis). Orange line: MSCI World 12-month forward EPS (right axis). The gray shaded area marks the three months after Russia invaded Ukraine — oil surged and global earnings expectations were revised sharply lower (the “2022 playbook”). This time, AI-driven EPS keeps climbing despite oil at $103. The market is betting it’s different. This chart poses the issue’s central question: is it really?
The rally in risk assets is real, but its foundation is not. The CTA mechanical bid, the “valuations are cheap” excuse, the ceasefire illusion — these are all reasons the music keeps playing. None of them are reasons it won’t stop. The market is in a classic game of musical chairs: everyone knows the premise is fragile, but everyone believes they can get out before the music stops.
Hormuz has no solution. Last weekend’s 48-hour circus — open, fire, shut again — isn’t an accident. It’s the defining feature of this crisis. Even with a ceasefire, insurance rebuilds take 6–8 weeks minimum (per Hapag-Lloyd CEO), shipping recovery takes longer still, and the supply already lost is gone for good. Duration is not a risk. It is the only certain variable.
Keep reading with a 7-day free trial
Subscribe to Garrett's Signal to keep reading this post and get 7 days of free access to the full post archives.